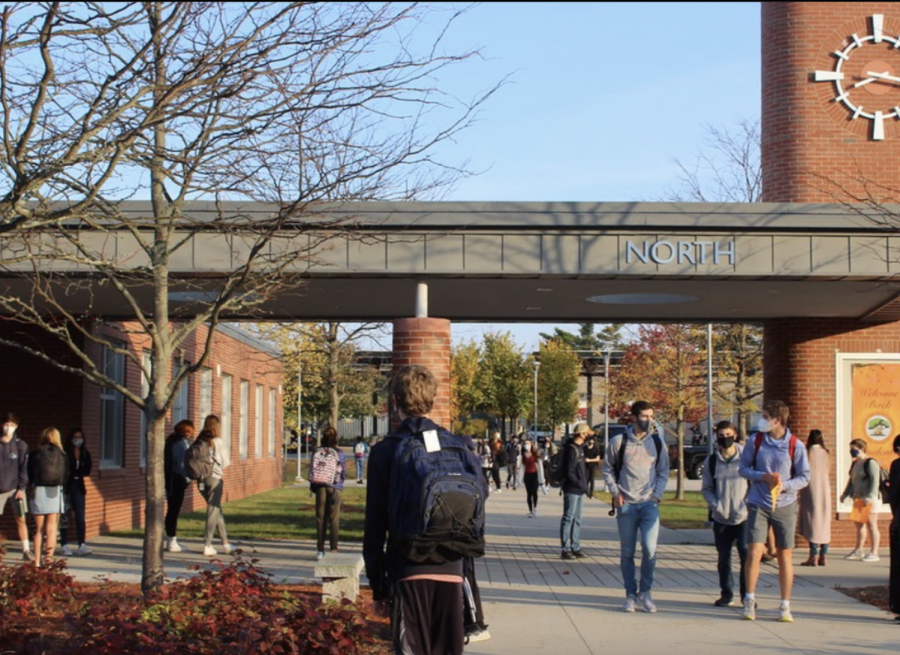
Credit: Deirdre Brown
Students walk around the high school campus. During the school committee meetings on March 3 and 10, Assistant Superintendent Parry Graham gave a presentation on student, parent and teacher feedback in addition to grade data for both the high school and middle school hybrid model.
Part 3: Student success in the hybrid model
Another piece of the puzzle was considering both the emotional and academic welfare of students.
Assistant Superintendent Parry Graham gave a presentation to the school committee with student, parent and teacher feedback from surveys provided by administrators. The presentation also contained data breaking down the grades students earned in the past semester.
“My goal in all of this was to find accurate patterns and stories in the data while still trying to be cautious of drawing conclusions too early,” Graham said in his presentation. “However, I think you’ll see in this data that there are some pretty strong, overwhelmingly positive patterns.”
Wayland Middle School
Parent Feedback
310 middle school parents responded to a survey Graham sent. Parents tended to be concerned about the material their kids were learning in comparison to a regular school year as well as how changes in the material would impact students next year. However, parents reported they were more concerned about their children’s social-emotional wellbeing than their academic wellbeing.
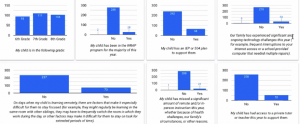
Parents were more likely to express concern if their child had an IEP or 504 or if their child struggled with executive functioning skills, which is the ability to self-initiate and complete tasks while staying organized. According to grade data, these students are struggling more than their peers.
Teacher Feedback
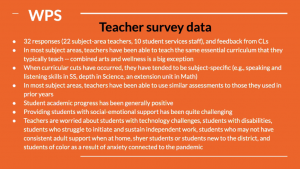
Teachers at the middle school in most subject areas have reported that they’ve been able to cover the most important aspects of their curriculum; more than half indicated they made little or no cuts to the curriculum.
Teachers also said they’ve been able to administer assessments similar to those in past years. Teachers said it’s difficult to provide students with adequate social-emotional support, especially to students with disabilities, students of color and students who struggle with executive functioning skills.
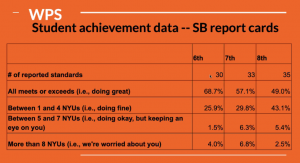
Grade Data
There’s a relatively small number of students showing academic concerns at the middle school, and there’s a high correlation between the concerns parents and teachers have expressed for certain student groups and those groups receiving lower grades.
Wayland High School
Teacher Feedback
55 teachers replied to the survey sent out by Graham: 40 of them were classroom teachers and 15 of them were student services staff. Student services staff could mean guidance counselors, special education staff, the METCO coordinator, etc.
All teachers said they needed to make cuts to their curriculum. However, very few teachers reported making significant cuts. Some science teachers did indicate they had to make significant cuts. With the loss of lab periods, an integral part of science class’s curriculum, teachers had to rethink how to teach students essential concepts. Science teachers were more likely to report that they are concerned about students’ progress. Subjects particularly hard-hit curriculum-wise are science, social studies, band and chorus. One-third of teachers, however, said there were positive aspects to their curriculum changes that they may adopt going forward.
Teachers were more likely to say that freshmen are behind than other grades in all subjects. Throughout all grade levels, the gap between academically high achieving and struggling students has widened.
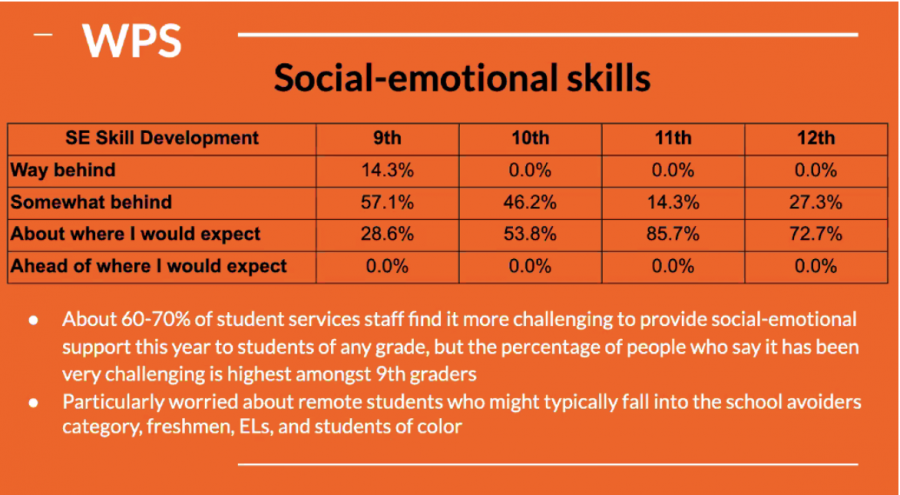
There is a concern for the social-emotional skills of sophomores and freshmen, and teachers reported it is most challenging to provide social-emotional support to freshmen.
Graham said the groups teachers are most concerned about are: “school avoiders” (kids who don’t like to go into school buildings who are now easily able to disengage from class through the remote program), freshmen, English language learners, students of color and other students in the remote program.
Student Feedback
660 students responded to a survey sent out by Principal Allyson Mizoguchi. Among student responses, not many subgroup patterns emerged. Students were not more likely to respond in a particular way because they are part of a certain group, like grade level or ethnicity.
Students reported they were less likely to be engaged during virtual learning than in person. In general, most hybrid students expressed appreciation for the Wednesday schedule, and WRAP students were more likely to feel less connected to school.
Grade Data
The data indicated that across the board, high school students are receiving higher grades than before. Graham said this is likely because teachers are assessing students differently than before, with smaller assessments that test on skill rather than content, and students have more opportunities to retake tests.
In addition, no midterms were administered this year, which Graham said tend to be lower than quarter grades.
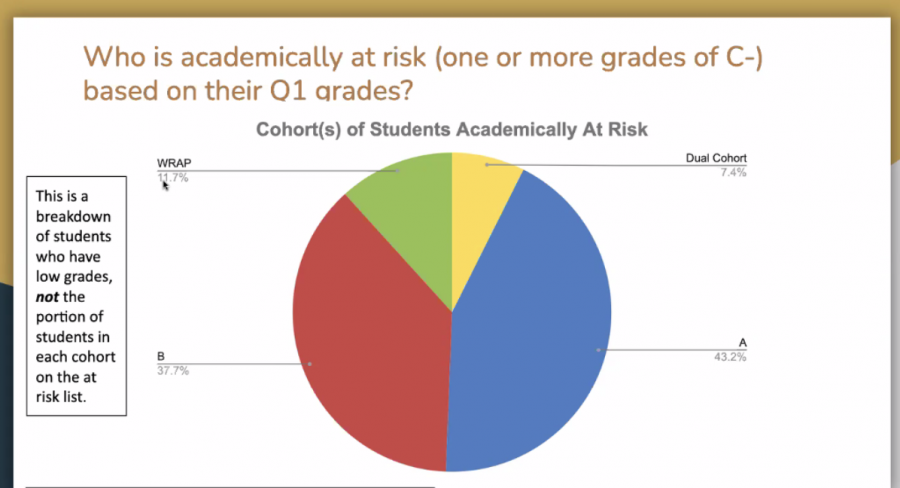
The percentage of “academically at-risk” students out of the entire student body is about 18-20%. An at-risk student is defined as a student who received one C- or more on their report card. C-’s occur more frequently in college and introductory courses than in honors and AP courses.
Certain groups of students are more likely to be at academic risk, such as students with an IEP, 504 and Black students.